Integration Management: Learning to see the Big Picture
Faculty
of Industrial Engineering and Management
Technion—Israel
Institute of Technology
Haifa
32000, ISRAEL
Corresponding
author: E-mail: shtub@ie.technion.ac.il
Tel.:
+972-4-829-4454, Fax: +972-4-829-3172
Integration Management:
Learning to see the Big Picture
Abstract
We
developed and tested a teaching methodology for Project Integration Management.
The PMBOK clearly states the need for such a methodology: "The project
management processes are usually presented as discrete processes with defined
interfaces while in practice they overlap and interact in ways that cannot be
completely detailed in the PMBOK Guide". We report the results of a
controlled experiment where Simulation Based Training (SBT) was used to train
students and practitioners in Project Management. Results indicate that the
participants evaluated the SBT environment highly and many of them even
indicated that they would use it for decision support in their real projects.
Key words
Project
Management, Simulation, Training, Integration Management, "Project Team
Builder (PTB)"
1. Introduction
Project managers face
complex decisions on a daily basis. In order to meet or exceed stake holders'
needs and expectations, project managers must plan their projects and keep them
on track in uncertain and dynamic environments. Many decisions must take into
account several knowledge areas simultaneously and the impact of the uncertain,
dynamic and constrained environment on the interactions among these knowledge
areas. Although the Body of Knowledge used as a basis for project management
may define and illustrate each knowledge area, the need to integrate the different
project aspects into one "big picture" presents a real challenge. The
Project Management Body of Knowledge (PMBOK, 2008) defines this need for Project Integration
Management: "Project Integration Management entails making choices about
resource allocation, making tradeoffs among competing objectives and
alternatives, and managing the interdependencies among Project Management
knowledge areas. The project management processes are usually presented as
discrete processes with defined interfaces while in practice they overlap and
interact in ways that cannot be completely detailed in the PMBOK Guide".
While most of the tools and techniques listed in the PMBOK are well defined and
relatively easy to teach, it is extremely difficult to teach how to make
tradeoffs among competing objectives and alternatives, and how to manage the
interdependencies among Project Management knowledge areas.
Integration Management is
a continuous effort performed throughout the project life cycle in a dynamic
(ever changing) and stochastic (subject to uncertainty) environment.
This paper presents a Simulation
Based Training (SBT) for teaching Project Management. The specific tool used
for this research, the "Project Team Builder (PTB)", won the Project
Management Institute (PMI) Product of the Year Award in 2008 and since then has
been used as a research lab and teaching tool in several leading universities
throughout the world.
This study focuses on teaching
students and practitioners how to plan, execute, monitor and control projects
in a dynamic-stochastic environment. A controlled experiment in which students
and practitioners managed a simulated version of a real project is reported
along with statistical analysis of data collected before and after the
experiment.
In the next section we discuss Simulation Based Training (SBT) and its use for
training in different areas. In Section 3 we describe
the Project Team Builder (PTB) and its use for training project teams and project
managers. Section
4 details the experiment design and Section 5 reports
its results. In Sections 6 and 7 we check
our hypotheses and draw conclusions, respectively. The final section summarizes
the research and offers future research directions.
2. Experiential
Learning and Simulation Based Training (SBT)
Experiential learning tools that integrate the traditional case study
approach with computer simulation are
based on the assumption that training simulators are an efficient way of
gaining, assimilating and retaining new knowledge, i.e., learning by doing
(Dempsy et al., 1997). The term Simulation Based Training (SBT) is frequently used
to describe the application of simulators for training. Reports on the
application of SBT in different areas are published frequently.
Simulation Based Training, as defined
by Salas et al. (2009), is a "synthetic practice environment that is
created in order to impart these competencies (i.e., attitudes, concepts,
knowledge, rules, or skills) that will improve a trainee's performance."
Simulation Based Training is
used in diverse areas: medicine (Park et al., 2007; De Giovanni et al., 2009; Fraser
et al., 2009); driver training (Ivanic et al., 2000); Production Manager
training (Ruohmaki, 1995; Shtub, 1999); and, pilot training (Rolfe & Staples, 1988).
The literature
describes several Project Manager training simulators (Pinto & Parente, 2003; Steele, 2009; Ioana & Collofello, 1999; Pfahl et al., 2001; Vanhoucke et al.,
2005; Davidovitch et al., 2006, 2008, 2009, 2010).
One reason for the popularity of SBT
is its perceived advantages over other training methods. Salas et al. (2009)
list the advantages of SBT for management education:
1. SBT is superior to other training
strategies for imparting complex applied competencies.
2. SBT can lead to learning in a
reduced timeframe.
3. SBT provides a more complex and
realistic learning environment than other training strategies.
4. SBT more rapidly allows for reality
to be simplified and manageable.
5. SBT provides a (relatively) risk-free
environment for learning and experimentation.
6. SBT is an ideal method for training
infrequently engaged but critical skills.
7. SBT can be quite affordable.
8. SBT is (usually) simple to learn and
operate.
9. SBT is a form of learner-controlled
training.
10. SBT is inherently more engaging than
other training methods.
This article presents research
findings on the application of SBT to project management in a controlled
environment. The simulator used in this study – the Project Team Builder (PTB) –
is described in the following section.
3. PTB - Project Team Builder
The Project Team Builder (PTB) is a training aid
designed to facilitate the training of project managers in a dynamic,
stochastic environment. It is based on the following principles:
·
A
simulation approach—PTB simulates one or more projects. The simulation is
controlled by a simple user interface and no knowledge of simulation or
simulation languages is required.
·
A
case study approach—PTB is based on the simulation of case studies. Each case
study is a project or a collection of projects performed under schedule, budget
and resource constraints in a dynamic stochastic environment. The details of
these case studies are built into the simulation and all the data required for
analysis and decision-making is easily accessed through the user interface. A
user-friendly case study generator facilitates the development of case studies based
on real or imaginary projects.
·
A
dynamic approach—PTB uses case studies that are dynamic in the sense that the
situation changes over time. A random effect is introduced to simulate the
uncertainty in the environment and decisions made by the user cause changes in
the state of the system being simulated.
·
A
model-based approach—PTB has a built-in decision support system. This system is
based on Project Management concepts. The model base contains well-known models
for scheduling, budgeting, resource management and monitoring and control.
These models can be consulted at any time.
·
A
decision support approach—PTB has a built-in database. Data on the current
state of the simulated system is readily available to the users. Furthermore,
it is possible to use the data as input to the models in the model base to
support decision-making.
·
An
integrated approach—the different aspects of the project are integrated and tradeoffs
are present between the different knowledge areas. For example, a change in the
mode of operation for one activity may impact one or more of the following: the
required resources, the cost, the duration, the level of risk and the
performances of the resulting deliverables.
·
A
user friendly approach—PTB is designed as a teaching and training tool. As
such, its Graphic User Interface (GUI) is friendly and easy to learn. A typical
user learns how to use PTB in less than an hour.
·
Integration
with commercial project management tools—PTB is integrated with commercial
project management software so that the users can analyze the scenario on the
commercial project management software and support decisions with tools that
are actually used in the users’ organizations.
·
Scenario
flexibility—PTB separates the simulation engine from the scenario library. The
result is flexibility provided by a scenario building program with which the
trainer or teacher can build project scenarios based on real or imaginary
projects. Although PTB contains a scenario library, the teacher or trainer has
access to the scenario builder and can build any number of scenarios based on
the training objectives and the required learning outcomes. The scenario
builder can import real projects from commercial project management software
and transform the information into a project scenario for the simulator.
·
A
built-in learning history recording and inquiry mechanism—the user has access
to past situations and decisions in the simulation and to the consequences of
these decisions.
In PTB the user decides
when and how to perform each task – decisions that affect the project cost,
schedule, and robustness as well as the performance of the system delivered by
the project. PTB also enables project monitoring and control during the
simulated execution phase of the project. PTB can be used as a stand-alone
system as it contains models for scheduling, budgeting, resource management,
cash management, monitoring and control. It can also be used with commercial project
management software such as Microsoft Project, if training in the use of such
software is part of the desired learning outcome.
4. The
Experiment
To
study the contribution of SBT to the ability of trainees to integrate the
different aspects of project management, a controlled experiment was designed. Project
managers, systems engineers and graduate students participated in the
experiment. All participants used the same simulator version running the same
scenario. The scenario used in the experiment is based on a real project – the
development and production of an airborne communication system. The project was
presented to the participants and discussed by the (actual) project manager
along with the real project plan in Microsoft Project.
In
the simulated project the goal is to maximize the benefit of the newly
developed airborne communication system while minimizing the cost and the duration
of the project. A clear trade off exists between these three objectives and
participants could impact the results by deciding what technologies to select
and how to allocate resources to project activities.
Prior
to the training session and at the end of the simulation session, participants
filled out a questionnaire focusing on learning and decision making with PTB.
4.1 Scenario
Description
The
scenario used is based on a real project:
-
The
air force decided to replenish the communication systems in airborne platforms
and in ground stations.
-
The
new communication systems should have all the capabilities of the currently
used system as well as some new capabilities.
The
system block diagram is presented in Figure 1.
-
Figure 1: System block diagram
4.2 System Requirements
·
BW
(Bandwidth) = 5MHz
·
Minimum
SNR (Signal to Noise Ratio) = 4dB
·
System
NF (Noise Figure) = 15dB
·
Frequency
= 50 MHz
·
Required
range for communication route R (Range) = 100Km
·
Volume
= 6000 cm3 (30x20x10)
Schematic
structure of the system is presented in Figure 2, where
NF
– noise
Pt
– transmitter power
Figure 2: Schematic structure of the system
The PTB calculates the system's performance based
on the user's decisions. The total benefit score is calculated as a weighted sum
of the scores for each requirement. Each requirement is a function of one or
more technological decisions and the user’s objective is to trade off the
desired values of the requirements against minimizing cost and duration. Figure
3 depicts the data on system requirements presented to the user:
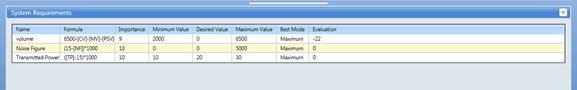
Figure 3: PTB system requirements screen
After the user has made all the decisions, a
project plan is generated and presented in the form of a Gantt chart. The Gantt
chart of the project as shown by the PTB simulator is presented in Figure 4.
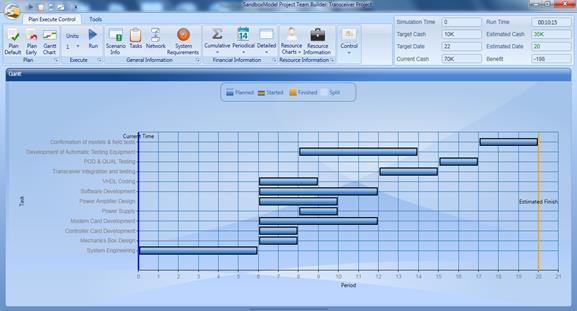
Figure 4: PTB Gantt chart screen
4.3 The Participants
Three groups participated
in the experiment: 16 very experienced project managers (with over 5 years of
experience), 17 experienced project managers (with less than 5 years of
experience), and 18 graduate students (taking a graduate course in Systems
Engineering). Some participating project managers work as systems engineers. The
very experienced group included 12 men and 4 women aged 48 to 65 with an
average age of 57. Figure 5
illustrates the
level of experience of
the very experienced group.
Figure 5: The experience of the very experienced project managers group
The
experienced project managers group included 12 men and 5 women aged between 28
and 62 with an average age of 46. Figure
6
illustrates the level of experience of
this group.
Figure 6: The experience of the experienced project managers group
The
graduate students group included 17 men and one woman aged from 29 to 47 with
an average age of 37.
5. The
experiment's Results
The following legends are
used to represent the three groups of participants:
![]() Experienced
Experienced
![]() Very experienced
Very experienced
![]() Students
Students
5.1 Simulation Results
Project duration: As seen
in Figure 7, the average duration of the simulated project decreases as participants’
experience level increases.
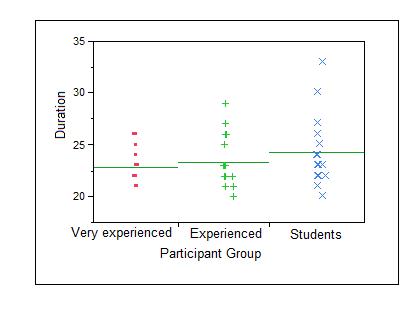
Figure 7: One-way analysis of duration by participants’ experience level
Project profit
(minimizing project cost is identical to maximizing its profit): As seen in
Figure 8, the simulated project’s profit decreases as participants’ experience
level increases; therefore, the simulated
project’s cost increases as participants’ experience level increases.
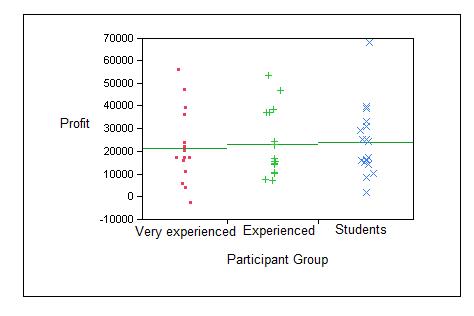
Figure 8: One-way analysis of simulated project’s profit by participants’ experience level
There are three clusters of compliance
with performance: low (benefit under 20,000), moderate (benefit between 20,000
and 80,000) and high (benefit over 80,000) where the benefit is calculated by
PTB as the weighted sum of the score of the communication system delivered by
the project groups. A one-way ANOVA was performed in order to test the
differences between the clusters. 97.4% of the variance is explained by the
performance conformance distribution. In other words, almost all of the variance
is explained. As can be seen in Figure 9, no clear relationship appears between
the participant groups and the benefit level achieved in the simulation.

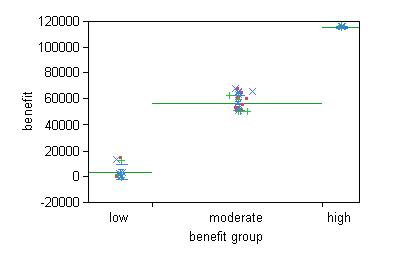
Figure 9: Clusters formed according benefit results
This
result is reinforced using the K-means Analysis Statistical Toolbox in Matlab:
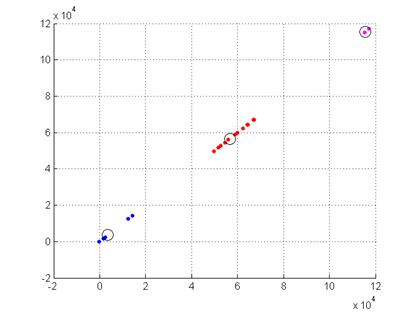
Figure 10: The three clusters formed according benefit results
The
K-means analysis shows the three clusters formed according benefit results.
6. Hypothesis testing
We
tested several hypotheses regarding participants’ performance measured by
benefit
Hypothesis
1:
As performance level increases, cost increases.
Result:
There is a significant correlation between performance and cost. (Chi
Square = 5.99, df=2, P<0.05): the better the performance, the higher the
cost.

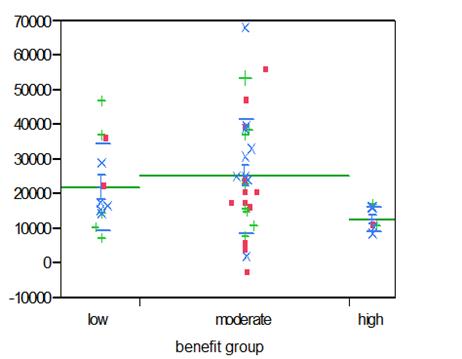
Figure 11: One-way analysis of cash by benefit group
Hypothesis 2:
There is a positive correlation
between the time it takes to run the simulation and the level of compliance
with performance.
Result: A significant (F=4.46, df=2, P<0.05) positive correlation between
the time it takes to run the simulation and the level of confirmation to
performance. The more time invested in simulation training, the higher the
performance levels.
Figure 12: One-way analysis of run time by benefit group
Hypothesis 3:
The delivery of a system fully complying with all requirements result in higher
project costs and lower profit.
Result:
There is a significant positive correlation between the level of compliance and
the project cost (F=7.14, df=2, P<0.05). Participants who delivered a fully compliant
system completed the project at a higher cost (cost increased by almost 50%)
than project managers who delivered a less compatible system.
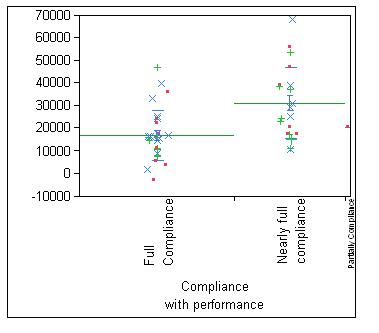
Figure 13: One-way analysis of profit and compliance with performance
7. Observations from Questionnaire Data
As
discussed earlier, pre - and post- simulation questionnaires were used to
collect data. Analysis of the data generated the following observations:
Observation 1: The duration
of the simulation (simulation run time) and assessment of the simulator
contribution to learning project management: as the average duration of simulation run increases (a
longer training period with the simulator), so does the positive perception of
its contribution (on a scale from 1 to 5, see Figure 14).
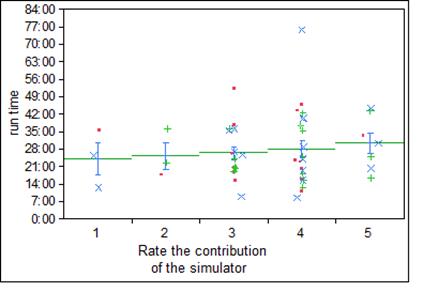
Figure 14: One-way analysis of run time by rate of simulation training contribution
Observation 2: There is a
positive correlation
between the performance level using the simulator and a positive evaluation of
the simulator as a tool for training in Project Management. As performance
level increases, so does the positive evaluation of the simulator as a tool for
training in Project Management.
. 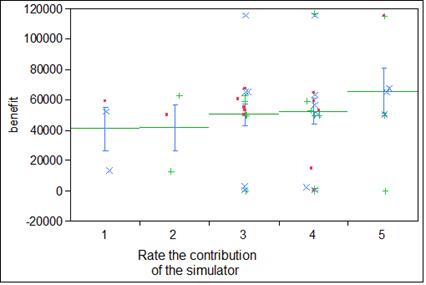
Figure 15: One-way analysis of benefit by rate of simulation training contribution
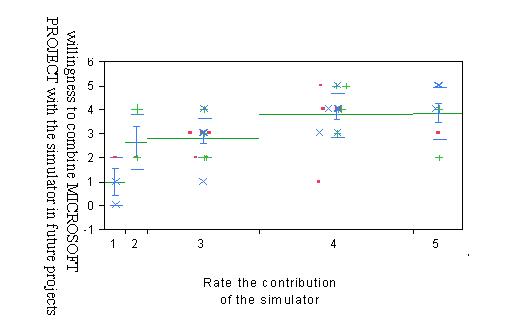
Observation 3: The declared
wish to integrate the simulator
with Microsoft Project (the
software used to manage the real project) in the future for managing real
projects increases
with the evaluation of the simulator contribution. We found that as participants’
positive evaluation of the simulator increased, their declared intention to
integrate it with the Microsoft project tool consistently increased (F=8.04,
df=4, P<0.05).

Observation 4: More than
60% of participants feel that the SBT tool supports decision making. In
addition, 70% believe that using the SBT tool before or while managing a
project can support the decision making process.
Figure 17: Frequency of replies to the statement: From my experience with other tools, using the simulator helps in making decisions
Figure 18: Frequency of the replies to the statement: Use of the tool prior to or during the project may assist decision making in the project
8.
Summary
The results
of this study indicate that SBT can help in training and teaching Project Integration
Management in a dynamic stochastic environment. SBT can be used for training
project managers with different levels of experience as well as students
learning the theoretical aspects of Project Management. Furthermore, we
observed that SBT tool users think that if it can run simulation scenarios that
are based on a real project, the tool can support project managers in the
actual management of projects.
Our
results point out that it may be valuable to train project teams using SBT approach
while focusing on the real project assigned to the team. By simulating a
scenario based on the real project, the team can learn how to integrate the
different aspects of Project Management. More importantly, the very same
learning process can improve teamwork aspects by training the team members in
working and solving problems.
The
design of SBT tools and their usage for training and decision support is a
complex challenge, motivated by our results that indicate the potential for
improved training, learning, and most teamwork.
References
Davidovitch, L., Parush, A., & Shtub, A. (2006). Simulation-based learning in engineering education: Performance and transfer in learning project management. Journal of Engineering Education, 289–299.
Davidovitch, L., Parush, A., & Shtub, A. (2008). Simulation-based learning: The learning-forgetting-relearning process and impact of learning history. Computers & Education, 50(3), 866–880.
Davidovitch, L., Parush, A., & Shtub, A. (2009). The impact of functional fidelity in simulator based learning of project management. International Journal of Engineering Education, 25(2), 333–340.
Davidovitch, L., Parush, A., & Shtub, A. (2010). Simulator-based team training to share resources in a matrix structure organization. IEEE Transactions on Engineering Management, 57(2), 288–300.
De Giovanni, D., Roberts, T., & Norman, G. (2009). Relative effectiveness
of high- versus low-fidelity simulation in learning heart sounds. Medical Education,
43(7), 661–668.
Dempsy , J. V., Lucassen, B. A., Haynes, L. L., & Casey, M. S. (1997). An exploratory
study of forty computer games. COE Technical Report, No. 97-2. University of
South Alabama, Mobile, AL.
Fraser, K., Peets, A., . ical Education, 43(8), 784–789.
Ioana, R., Collofello, J., & Lakey, P. (1999). Software process
simulation for reliability management. Journal of
Systems and Software, 46(2/3), 173–182.
Ivanic ,
K., & Hesketh, B. (2000). Learning from errors in a driving simulation:
effect on driving skills and self-confidence. Ergonomics, 43(12),
1966–1984.
Park,
J., MacRae, H., Musselman, L. J., Rossos, P., Hamstra, S. J., Wolam, S., & Reznick, R. K. (2007). Randomised
controlled trial of virtual reality simulator training: transfer to live patients.
American
Journal of
Surgery, 194(2), 205–211.
Parush, A.,
Pfahl, D., Klemm, M., & Ruhe, G. (2001). A CBT module with
integrated simulation component for software project management education and
training. Journal of Systems and Software, 59(3), 283.
Ruohmaki , V. (1995).
Viewpoints on learning and education with simulation games. In J. Riis (Ed.), Simulation
Games and Learning in Production Management
(pp. 13–25).
Salas, E., Wildman, J. I., & Piccolo, R. F. (2009). Using simulation-based
training (SBT) to enhance management education. Academy of Management
Learning and Education, 8(4), 559–573.
Shtub, A., Parush,
A., & Hewett, T. (2009). Guest editorial: The use of simulation in learning and teaching. International Journal of
Engineering Education, 25(2),
206–209.
Shtub, A.
(2011).
Project management and simulation based training–research and practice,
MSK Hesehv.
Shtub, A.
(2011). Project management and simulation with PTB, the project
team builder. Springer (forthcoming).